Below is the EB Weekly Market Report that I sent out earlier to our EarningsBeats.com members. This will give you an idea of the depth of our weekly report, which is a very small piece of our regular service offerings. We called both the stock market top in February and stock market bottom in April, and encouraged EB members to lower risk at the time of the former and increase risk at the time of the latter.
There is no better time to experience our service for yourself as we’re currently running a FLASH SALE that offers a 20% discount on annual memberships. The timing to join couldn’t be better as I’ll be providing my Q3 outlook to all EB annual members at 5:30pm ET today. A recording will be provided for those who cannot attend the session live. So if you sign up later today or tomorrow or the next day, we’ll make sure you get a time-stamped copy of the recording.
In the meantime, enjoy this complimentary copy of this week’s report….
ChartLists/Spreadsheets Updated
The following ChartLists/Spreadsheets were updated over the weekend:
- Strong Earnings (SECL)
- Strong Future Earnings (SFECL)
- Strong AD (SADCL)
- Raised Guidance (RGCL)
- Bullish Trifecta (BTCL)
- Short Squeeze (SSCL)
- Leading Stocks (LSCL)
- Manipulation Spreadsheet*
*We continued to add more stocks to our Manipulation Spreadsheet and you’ll see that a few have tabs, but do not have data yet. Those 3 are still “under construction”. I also added a “Summary” tab where I’ve begun to sort the individual stocks in order based on a proprietary relative AD ranking system. Don’t ask me what it means yet, because it’s still very much a work in progress as well. I’m looking at the intraday relative performance of individual stocks vs. the benchmark S&P 500. So positive percentages represent better intraday AD performance than the S&P 500, while negative percentages represent the opposite. One thing I’ll be watching is to see if stronger relative AD lines precede relative strength in stocks on a forward-looking basis. It certainly did in the case of both Netflix (NFLX) and Microsoft (MSFT) from several weeks ago when I pointed out what appeared to me to be significant accumulation in March/April when the stock market bottomed. Both NFLX and MSFT have soared since that time. I’ll keep everyone posted on the progress of my research over the next many weeks and months.
Weekly Market Recap
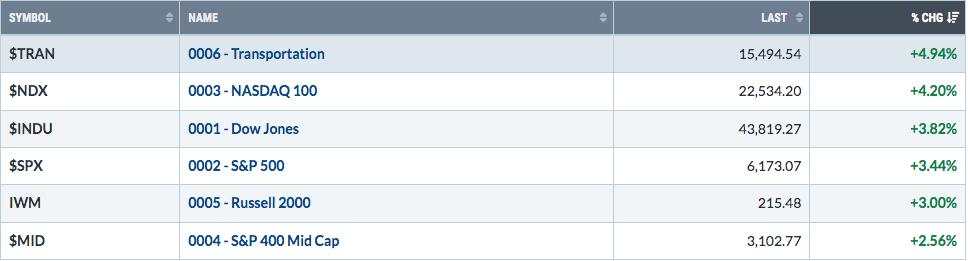
Major Indices
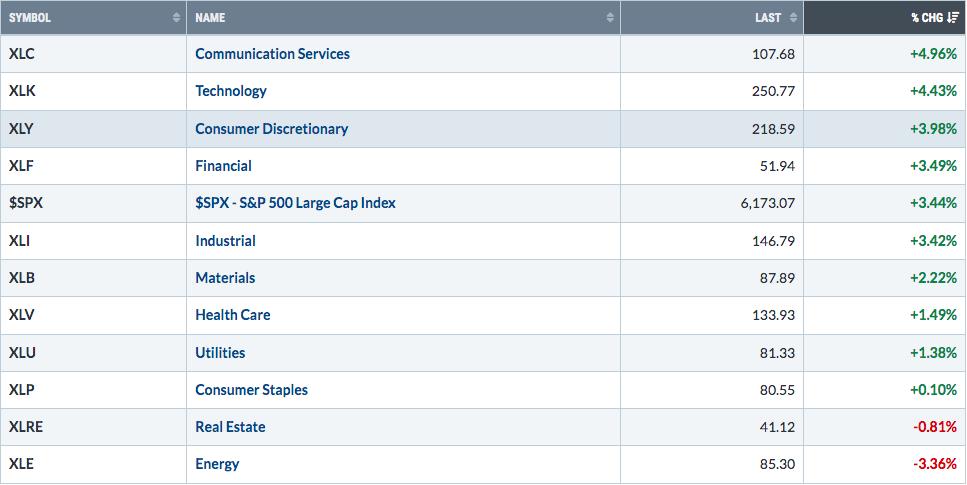
Sectors
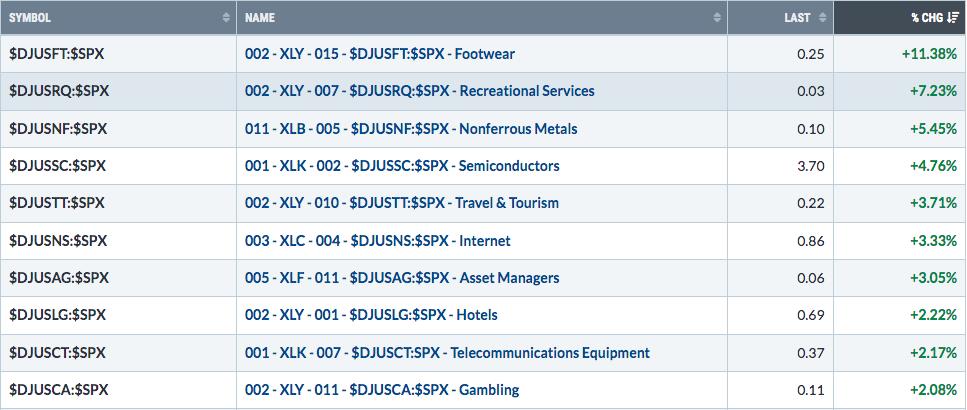
Top 10 Industries Last Week
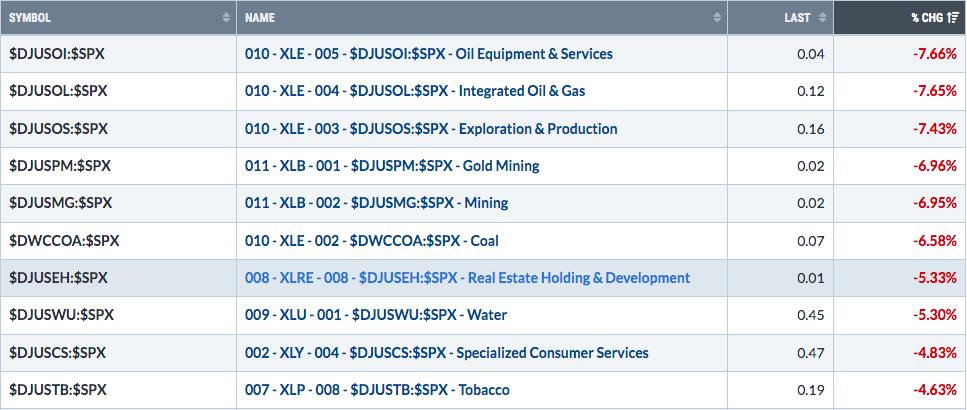
Bottom 10 Industries Last Week
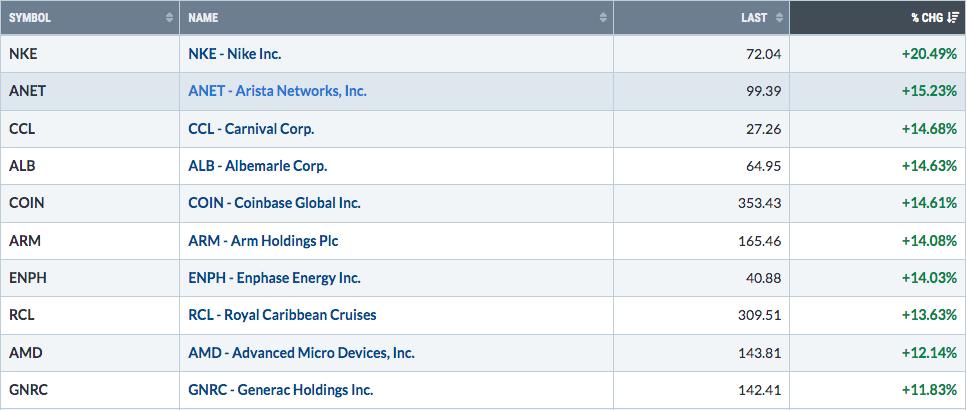
Top 10 Stocks – S&P 500/NASDAQ 100
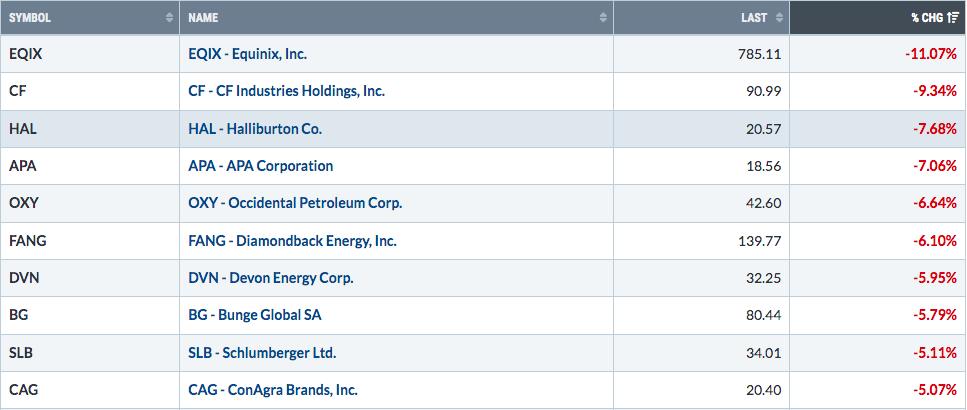
Bottom 10 Stocks – S&P 500/NASDAQ 100
Big Picture
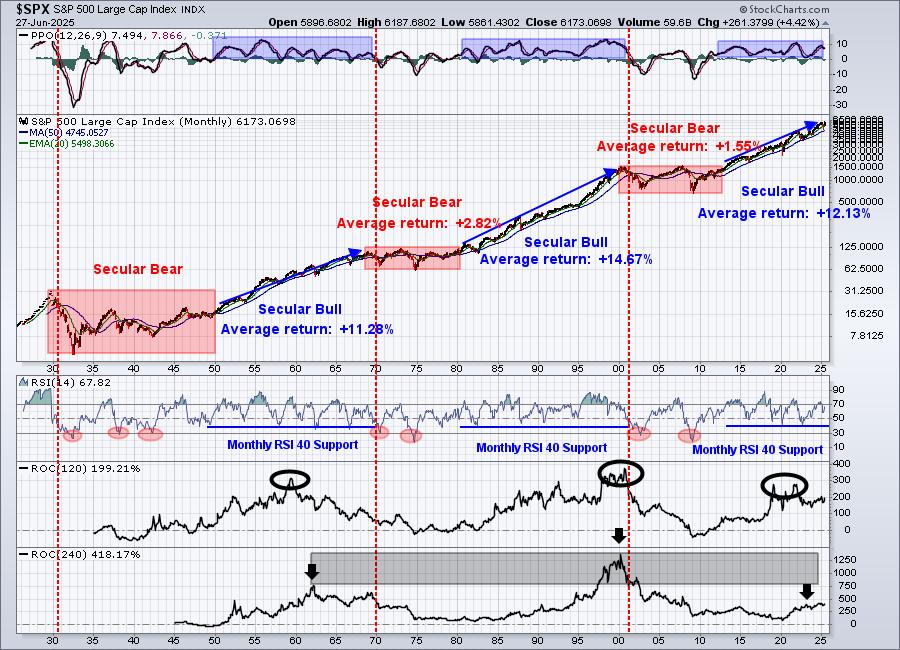
If you’re a long-term investor, stepping back and looking at the stock market using this 100-year chart enables you to avoid pulling unnecessary sell triggers, because of the media, permabears, negative nellie’s, and all the “news” out there. The above chart never once flashed anything remotely signaling a sell signal and now, here we are, back at all-time highs. Simply put, it filters out all the noise that we hear on a day-to-day basis and keeps our wits about us.
Sustainability Ratios
Here’s the latest look at our key intraday ratios as we follow where the money is traveling on an INTRADAY basis (ignoring gaps):
QQQ:SPY
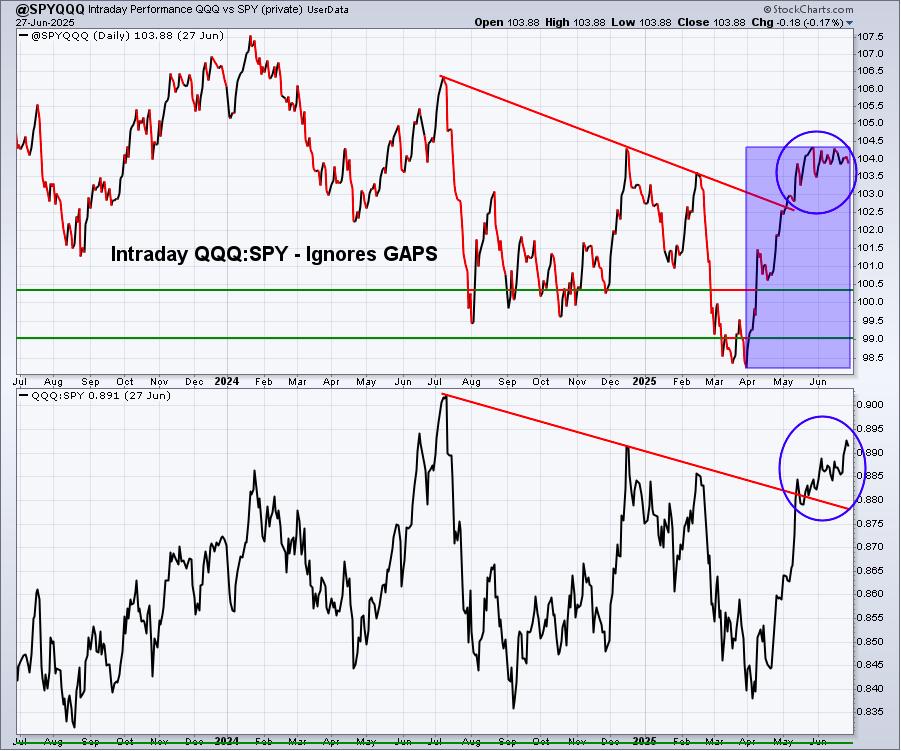
Absolute price action on both the S&P 500 and NASDAQ 100 has now seen all-time high breakouts, which alone is quite bullish. We want to see aggressive vs. defensive (or growth vs. value) ratios moving higher to indicate sustainability of any S&P 500 advance. In my view, we’re seeing that. But the intraday QQQ:SPY ratio continues to hesitate. A breakout in this intraday relative ratio would most definitely add to the current bullish market environment.
IWM:QQQ
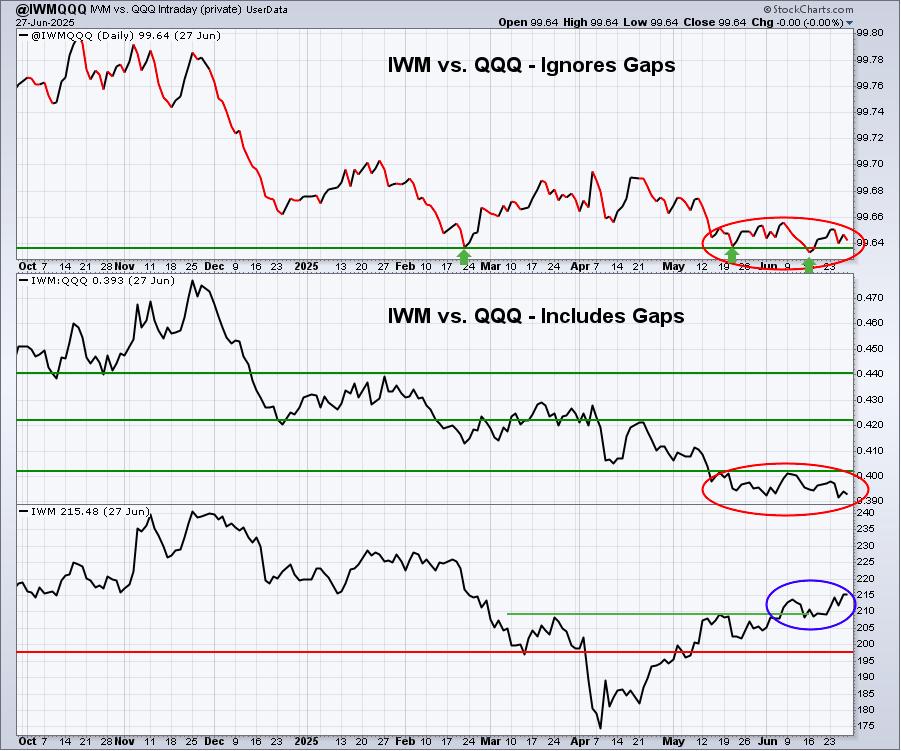
I’m seeing signs of an impending rate cut by the Fed. However, if I’m being completely honest, one signal that we should see is outperformance in small caps and a rising IWM:QQQ ratio. That hasn’t happened – at least not yet. If a rate cut starts to become clearer, I would absolutely expect to see much more relative strength in small caps. Keep an eye out for that.
XLY:XLP
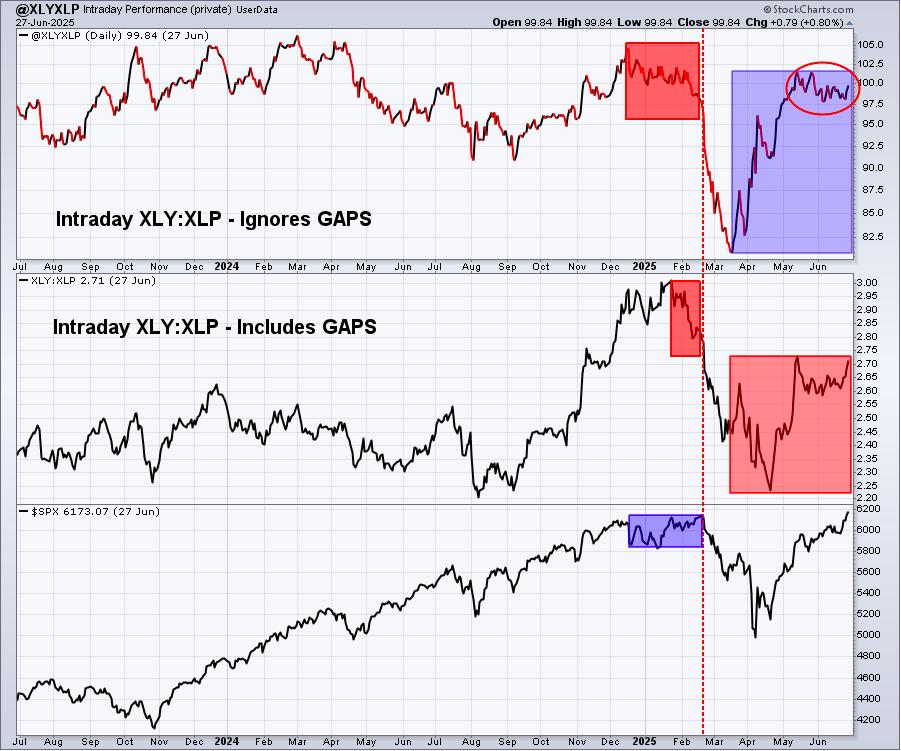
I pay very close attention to the XLY:XLP ratio and, more specifically, this INTRADAY XLY:XLP ratio. This chart helped me feel confident in calling a market top back in January/February. If you recall, that’s when we said it was waaaaay too risky to be long the U.S. stock market. By the time we had bottomed in April, the blue-shaded area highlighted the fact that the XLY vs. XLP ratio had already begun to SOAR! That’s why, on Friday, April 11th, I said I was ALL IN on the long side again.
These signals are golden and, when used in conjunction with all of our other signals, can provide us extremely helpful clues about stock market direction. If these ratios begin to turn lower in a big way, then yes we’ll need to grow more cautious. However, right now, they couldn’t be any more bullish. Expect higher prices ahead.
Sentiment
5-day SMA ($CPCE)
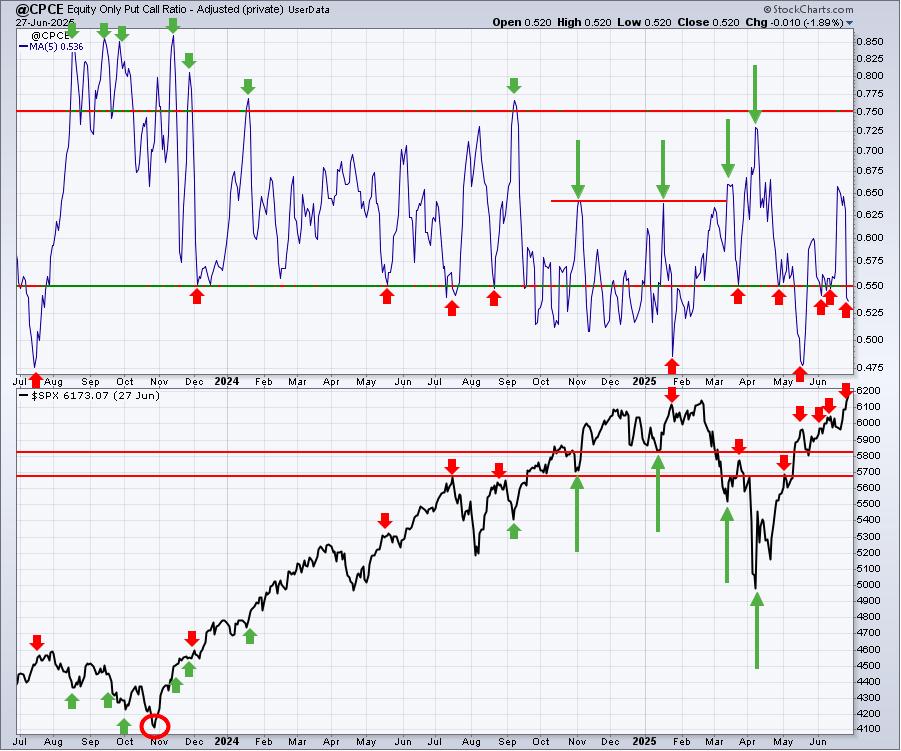
Sentiment indicators are contrarian indicators. When they show extreme bullishness, we need to be a bit cautious and when they show extreme pessimism, it could be time to become much more aggressive. Major market bottoms are carved out when pessimism is at its absolute highest level.
The S&P 500 had struggled a bit once 5-day SMA readings of the CPCE fell to the .55 area, a sign of market complacency and a possible short-term top. We saw a bit of a pullback in June, which many times is all we get during a secular bull market advance. My sustainability ratios are supporting a higher move by stocks and I know from history that overbought conditions can remain overbought. I also know that sentiment does a much better job of calling bottoms than it does calling tops. That’s why I will not overreact every time this 5-day moving average of the CPCE falls back below .55. During Q4 2024, we saw plenty of 5-day SMA readings below .55 and, while the S&P 500 was choppy, bullishness prevailed throughout. So just please always keep in mind that these 5-day SMA readings are our “speed boat” sentiment indicator that changes quite frequently. When it lines up with other bearish or topping signals, we should take note. But reacting to every subtle move in this chart is a big mistake, in my opinion.
253-day SMA ($CPCE)
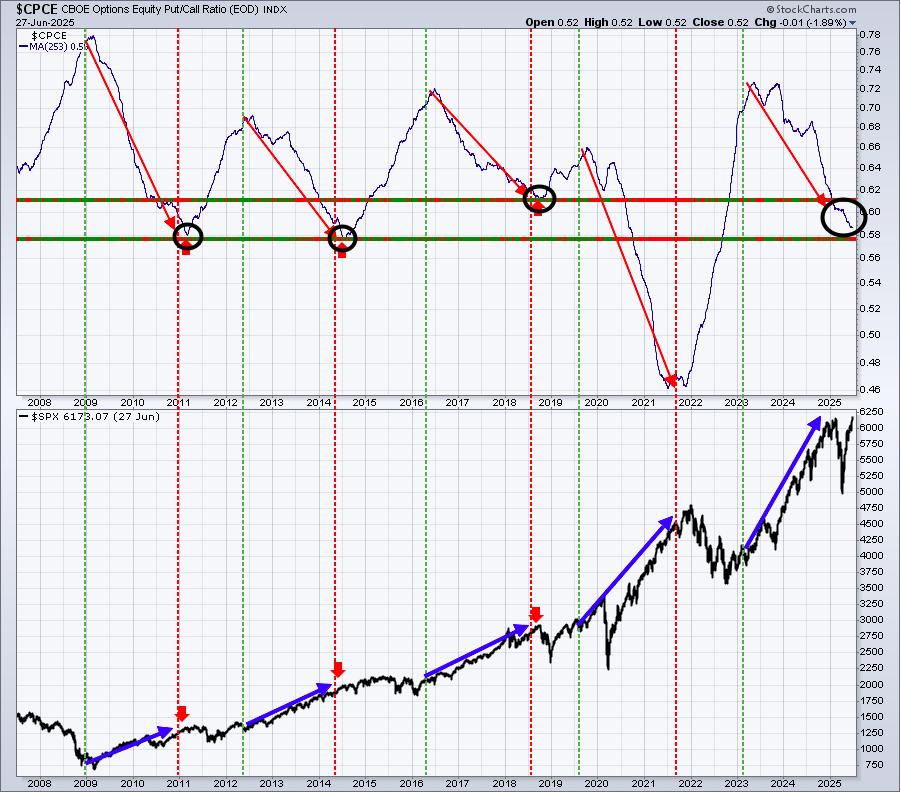
This longer-term 253-day SMA of the CPCE is our “ocean-liner” signal, unlike our speedboat indicator. This one usually provides us a very solid long-term signal as the overall market environment moves from one of pessimism to complacency and vice versa. Look at the above chart. When the 253-day SMA is moving lower like it is now, it accompanies our most bullish S&P 500 moves. It makes perfect common sense as well. Once this 253-day SMA moves to extremely high levels and begins to roll over, the bears have already sold. We typically have nowhere to go on our major indices, except higher once sentiment becomes so bearish. The opposite holds true when the 253-day SMA reaches extreme complacency and starts to turn higher. We saw that to start 2022, which, at the time, I stated was my biggest concern as we started 2022. If you recall, I said to look for a 20-25% cyclical bear market over a 3-6 month period on the first Saturday in January 2022. The above chart was my biggest reason for calling for such a big selloff ahead of the decline.
These charts matter.
Long-Term Trade Setup
Since beginning this Weekly Market Report in September 2023, I’ve discussed the long-term trade candidates below that I really like. Generally, these stocks have excellent long-term track records, and many pay nice dividends that mostly grow every year. Only in specific cases (exceptions) would I consider a long-term entry into a stock that has a poor or limited long-term track record and/or pays no dividends. Below is a quick recap of how these stocks looked one week ago:
- JPM – challenging all-time high
- BA – substantial improvement, would like to see 185-190 support hold
- FFIV – very bullish action above its 20-month SMA
- MA – very steady and bullish long-term performer
- GS – trending higher above 20-month EMA
- FDX – trying to clear falling 20-week EMA
- AAPL – monthly RSI at 50, which has been an excellent time to buy AAPL over the past two decades
- CHRW – 85-90 is solid longer-term support
- JBHT – would like to see 120-125 support hold
- STX – long-term breakout in play, excellent trade
- HSY – breaking above 175 would be intermediate-term bullish
- DIS – now testing key price resistance in 120-125 range
- MSCI – monthly RSI hanging near 50, solid entry
- SBUX – moved back above 50-week EMA, short-term bullish
- KRE – long-term uptrend remains in play
- ED – has been a solid income-producer and investment since the financial crisis low in 2009
- AJG – few stocks have been steadier to the upside over the past decade
- NSC – continues to sideways consolidate in very bullish fashion
- RHI – trending down with potential sight set on 30
- ADM – looks to be reversing higher off long-term price support near 43
- BG – 65-70 price support held, now looking to clear 50-week SMA to the upside
- CVS – excellent support at 45 or just below, just failed on bounce at 50-month SMA at 72
- IPG – monthly RSI now at 37 and also testing 4-year price support near 22.50
- HRL – long-term price support at 25 and stock now showing positive divergence on monthly chart – bullish
- DE – one of the better 2025 momentum stocks on this list
Keep in mind that our Weekly Market Reports favor those who are more interested in the long-term market picture. Therefore, the list of stocks above are stocks that we believe are safer (but nothing is ever 100% safe) to own with the long-term in mind. Nearly everything else we do at EarningsBeats.com favors short-term momentum trading, so I wanted to explain what we’re doing with this list and why it’s different.
Also, please keep in mind that I’m not a Registered Investment Advisor (and neither is EarningsBeats.com nor any of its employees) and am only providing (mostly) what I believe to be solid dividend-paying stocks for the long term. Companies periodically go through adjustments, new competition, restructuring, management changes, etc. that can have detrimental long-term impacts. Neither the stock price nor the dividend is ever guaranteed. I simply point out interesting stock candidates for longer-term investors. Do your due diligence and please consult with your financial advisor before making any purchases or sales of securities.
Looking Ahead
Upcoming Earnings
Very few companies will report quarterly results until mid-April. The following list of companies is NOT a list of all companies scheduled to report quarterly earnings, however, just key reports, so please be sure to check for earnings dates of any companies that you own. Any company in BOLD represents a stock in one of our portfolios and the amount in parenthesis represents the market capitalization of each company listed:
- Monday: None
- Tuesday: STZ ($29 billion)
- Wednesday: None
- Thursday: None
- Friday: None
Key Economic Reports
- Monday: June Chicago PMI
- Tuesday: June PMI manufacturing, June ISM manufacturing, May construction spending, May JOLTS
- Wednesday: June ADP employment report
- Thursday: Initial jobless claims, June nonfarm payrolls, unemployment rate & average hourly earnings, May factory orders, June ISM services
- Friday: None – stock market closed in observance of Independence Day
Historical Data
I’m a true stock market historian. I am absolutely PASSIONATE about studying stock market history to provide us more clues about likely stock market direction and potential sectors/industries/stocks to trade. While I don’t use history as a primary indicator, I’m always very aware of it as a secondary indicator. I love it when history lines up with my technical signals, providing me with much more confidence to make particular trades.
Below you’ll find the next two weeks of historical data and tendencies across the three key indices that I follow most closely:
S&P 500 (since 1950)
- Jun 30: +34.34%
- Jul 1: +72.77%
- Jul 2: +16.76%
- Jul 3: +77.19%
- Jul 4: +0.00% (market closed – holiday)
- Jul 5: +39.40%
- Jul 6: +22.32%
- Jul 7: +17.62%
- Jul 8: -16.29%
- Jul 9: +76.54%
- Jul 10: -16.59%
- Jul 11: +13.23%
- Jul 12: +36.89%
- Jul 13: -5.67%
NASDAQ (since 1971)
- Jun 30: +73.30%
- Jul 1: +63.18%
- Jul 2: -47.43%
- Jul 3: +46.02%
- Jul 4: +0.00% (market closed – holiday)
- Jul 5: +7.04%
- Jul 6: -10.79%
- Jul 7: +60.19%
- Jul 8: -10.10%
- Jul 9: +86.44%
- Jul 10: -27.94%
- Jul 11: +11.18%
- Jul 12: +128.28%
- Jul 13: +61.52%
Russell 2000 (since 1987)
- Jun 30: +99.14%
- Jul 1: +30.53%
- Jul 2: -113.05%
- Jul 3: +44.57%
- Jul 4: +0.00% (market closed – holiday)
- Jul 5: -4.89%
- Jul 6: -76.61%
- Jul 7: +43.95%
- Jul 8: +37.24%
- Jul 9: +31.88%
- Jul 10: -17.39%
- Jul 11: +29.75%
- Jul 12: +89.15%
- Jul 13: +63.13%
The S&P 500 data dates back to 1950, while the NASDAQ and Russell 2000 information date back to 1971 and 1987, respectively.
Final Thoughts
All-time highs are always a time for me to say “I told you so” to the bears, since I’ve been a firm believer that we remain in a secular bull market advance – one in which we should EXPECT to see higher prices and all-time highs. This latest rally is being fully supported by risk-on areas of the market, which will almost certainly lead for more and more all-time highs down the road.
Here are several things I’m watching this week:
- Jobs. The ADP employment report will be out on Wednesday and the more-closely-watched nonfarm payrolls will be released on Thursday this week since the stock market is closed on Friday. ANY sign of weakness in these reports will begin to put mounting pressure on the Fed to cut rates in late July at their next meeting.
- Technical Price Action. Any time we’re setting new all-time highs, I start off with a bullish mindset. I only turn bearish if I’m inundated with warning signals. Currently, I see few of those.
- History. We can now turn our attention to upcoming earnings season and, historically, that’s a bullish thing. Pre-earnings season runs to the upside are common and, if you scroll up and check out historical returns for days over the next couple weeks, you’ll see that July normally performs well – especially the first half of the month.
- 10-Year Treasury Yield ($TNX). The 10-year treasury yield has been in decline for 3 straight weeks, falling from 4.52% on June 9th to 4.24% just a few minutes ago. The money rotating into bonds is a very strong signal that inflation is NOT a problem. It’s also a signal that the Fed “should be” considering a rate cut at its next meeting.
- Breakouts. We’ve seen big breakouts in key areas like semiconductors ($DJUSSC), software ($DJUSSW), and investment services ($DJUSSB), but there will be plenty more. Travel & tourism ($DJUSTT) joined the party on Thursday. Banks ($DJUSBK) are on the verge of a breakout. The way I look at it? The more the merrier!
Happy trading!
Tom